The policy and stress lab
The lab answers questions of the form what does this change do? It runs the province as it is (the baseline) and the province with the change (an arm) on the same seeds, side by side on the worker pool, and reports each indicator's paired effect with a 95% interval. Open it from the Policy lab tile or Run › Policy and Stress Lab.
Asking a question
- Pick a template. The chips are grouped for actuaries, governments and social development; hover over one for its question. The templates page lists every arm. The lab starts on the first, SAM life stresses on the burial society.
- Change its numbers, if you like: the question's wording, and the value of every numeric parameter an arm changes (each input shows the default beside it). Shocks, tables and non-numeric changes are shown but not editable here.
- Choose seeds and years: 2 to 64 seeds, 1 to 40 years (8 and 10 to start).
- from this province's basis: tick it to start every arm, and the baseline, from the province as you have built it in the Scenario panel (its parameters, a table it lives on, its shocks) instead of the defaults.
- Run on the server.
To add or remove arms, edit labels or shocks, or ask a question no template asks, write an experiment file: Open in the lab shows any experiment file here, and running one from the workbench opens its result here too.
Years rebuild a template
Changing Years on a template rebuilds its arms from the template (a stress that lasts the whole run must last the new number of years), which puts any numbers you edited back to the template's.
The cost
A job may ask for at most 800 province-years: seeds × years × (arms + 1). The lab shows the estimate before you run (about ten seconds of one worker per province-year, eight workers side by side) and refuses a job that is too large, saying why. While a job runs, the bar counts runs done; Cancel drops the runs not yet started, and the running ones stop at the end of the simulated day they are on. The job carries on while the drawer is closed, and the Policy lab tile counts it.
Reading the result
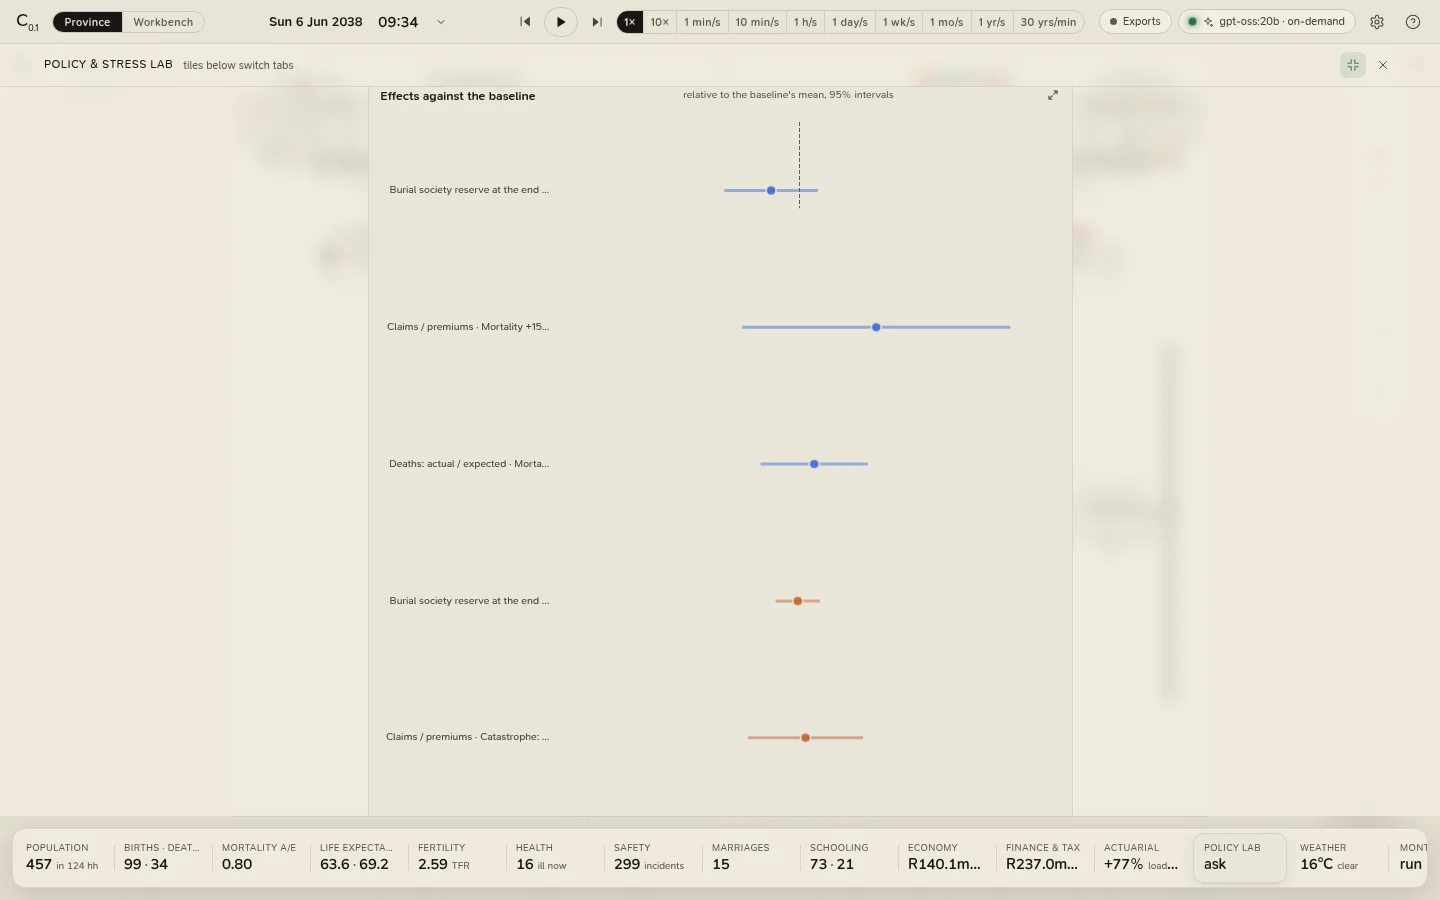
Effects against the baseline: a forest plot of the indicators the question leads with, each effect as a share of the baseline's mean, with its 95% interval and a line at zero.
Every indicator: all 21 indicators, the lead ones first: the baseline's mean over the seeds, then for each arm the effect with its interval, and better k/n, the number of seeds in which the arm moved the indicator the better way. An effect whose interval crosses zero is shown faint.
How an effect is computed:
- for each seed, the difference between the arm and the baseline on that seed;
- the effect is the mean of those differences;
- its 95% interval is the mean ± t × s / √n, with Student's t on n − 1 degrees of freedom;
- better k/n counts the seeds whose difference went the indicator's better way (ties do not count).
Because the arm and the baseline share every random number the change does not touch, the differences are far less noisy than the indicators themselves: a paired comparison needs far fewer seeds than two separate sets of runs. An interval that crosses zero is an effect these seeds cannot tell from chance; more seeds narrow every interval.
Keeping it
- Save to workspace (with a workspace open) writes the result into
results/<title>-<date>/in the workspace: the runs and the effects as CSV, the whole result as JSON, a README with its provenance, and the experiment it was run from, so it can be run again. A run from an experiment file is saved there by itself. - Download CSV saves the runs; JSON saves the whole result.
- Recent experiments lists the last fifty experiments the engine has kept; click one to show it again.